Out of this World
Europe’s early maps of the universe brought the stars down to earth and into people’s homes By Jeffrey S. Murray
It is the middle of the night when I lie down on the recently mowed hayfield beside our house at Burritt's Rapids in the Ottawa Valley to study the stars with my 7-year-old nephew. Even though I put a wool blanket on the ground, I can still feel the grass stubble poking into the back of my neck. It is a clear summer's night, and we are far enough from the city that there are no extraneous bright lights obscuring our view. We brought along our flashlights and a star chart of the northern hemisphere. With one light trained on the chart, we point the other into the sky and use its beam to trace the outlines of the constellations.
Our map is austere. It consists simply of white star symbols on a plain dark blue background, and although dotted lines group the stars belonging to individual constellations, the chart provides no clues as to how the stars fit in to their arrangement. Just where does Polaris sit within the constellation Ursa Minor—at the top or bottom? Just what or who was Ursa Minor, and what is he, she, or it doing in our sky? With this useful but aesthetically unappealing chart in hand, I cannot help lamenting how much celestial mapping has changed in the four hundred years since Galileo first turned his telescope skyward. His simple act might have forever changed humankind’s understanding of the universe, but it was Europe’s mapmakers who first brought the stars into people’s homes.
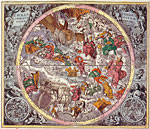
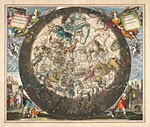
Modern-day historians say star mapping is at least as old as its terrestrial counterpart and might, indeed, predate it. Even at their best, though, European star maps of two millennia ago were little more than pictures of small pieces of the night sky, showing the approximate relationship between the stars and their alignment within a constellation. It was in 1515, just two decades after Columbus sailed to the New World, that German engraver Albrecht Dürer thought to put all the pieces together on one chart to give a complete representation of the heavens. Dürer not only charted all the northern-sky constellations together, he also printed coordinates from which star positions could be read with a reasonable degree of precision. In the process, he ushered in an entirely new form of art.
It is hardly coincidental that Dürer’s first star map appeared about a decade after the printing of the first terrestrial maps of the world and about half a century after the invention of a movable-type printing press by one of his fellow countrymen, Johannes Gutenberg. The two developments gave Dürer the theory and technology he required: The production of world maps provided the mathematical formulae by which a spherical shape could be projected accurately onto a flat surface; the printing press gave him the means by which to implement and disseminate his chart. More important, the introduction of the printing press ushered in the Renaissance, the rebirth of culture and society across Europe.
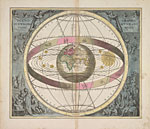
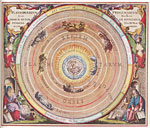
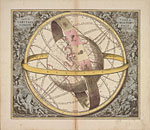
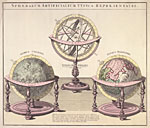
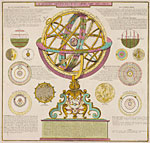
Celestial charts fit nicely into this new intellectual environment. Grouping the stars into constellations gave astronomers and navigators a useful frame of reference—a topography, if you like—to the night’s sky. With the wider distribution of star charts made possible by the printing press, knowledge of the stars could also be brought into the home and made a part of a child's education. As a mark of status, the more affluent not only wanted star charts hanging on the walls in their homes and bound into atlases in their libraries, but they also wanted them included in their paintings. Some families even had their portrait painted with everyone gathered around one of the many new devices that were capable of demonstrating the movement of the planets.
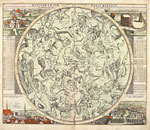
The amount of astronomical information included on the star maps varied: Some charts included the proper names of the important stars; others tried to distinguish between bright and faint stars by using symbols of different sizes or various types of tables that classified each star’s light intensity. They were mostly drawn as planispheres, just like the one my nephew and I had. That is, they were circular maps centered on one of the earth's poles and covering just one hemisphere. The stars of the zodiac—which can be seen by stargazers in either hemisphere—were arranged around the outer edge of the chart. Together, two planispheres showed the complete topography of the heavens. Initially the constellations were drawn as they would be seen on the surface of a celestial globe: with the viewer standing on the outside and looking from heaven through the stars to earth. This was the result of the mapmaker simply transferring to paper the star arrangement seen on a globe. It was not a very useful perspective by which to identify the constellations because everything on the chart was a mirror image of what could be seen from earth. Only later were star charts drawn as humans would see the stars when looking up into the night sky


